Web console (serve-ui)
faucet serve optionally serves an embedded browser-based web console at /
when built with the serve-ui Cargo feature. The console gives you a visual
interface for the same HTTP API that curl or an orchestrator would use —
useful for ad-hoc runs, browsing logs, and exploring connector schemas without
leaving a browser tab.
The console is a thin static single-page application bundled into the binary via
rust-embed. There is no separate deployment and no network call during startup.
Want to see it populated in one command? The Try it locally quickstart builds the CLI, runs a battery of demo pipelines, and leaves this console up with Runs, Datasets, and Lineage already filled in — the screenshots below are from it.
Enabling the feature
# Install with the embedded console (add serve-ui to your --features list)
cargo install faucet-cli --features serve-ui

# Or build locally
cargo build -p faucet-cli --features serve-ui
serve-ui implies serve, so you do not need to list both. The full
aggregate already includes serve-ui.
Once built, start the server normally:
FAUCET_SERVE_AUTH_TOKEN=s3cret faucet serve --listen 127.0.0.1:8080
Then open http://127.0.0.1:8080/ in a browser.
Token flow
The static shell at / is served without authentication so the browser can
load the page before it has a token. All /v1 API calls that populate the
console’s data are bearer-gated as usual.
On first load (or after a 401) the console prompts you to paste the bearer
token (the same value as FAUCET_SERVE_AUTH_TOKEN / --auth-token). The token
is stored in browser localStorage and sent as Authorization: Bearer <token>
on every subsequent /v1 request. A key-icon button in the top bar lets you
update or clear it at any time.
Security: the bearer token is as sensitive as the API itself — anyone who obtains it can submit arbitrary pipeline configs with the server’s identity (see the security model). Serve the console only over localhost or a TLS-terminating proxy; never paste a production token into a browser tab on a shared machine.
Views
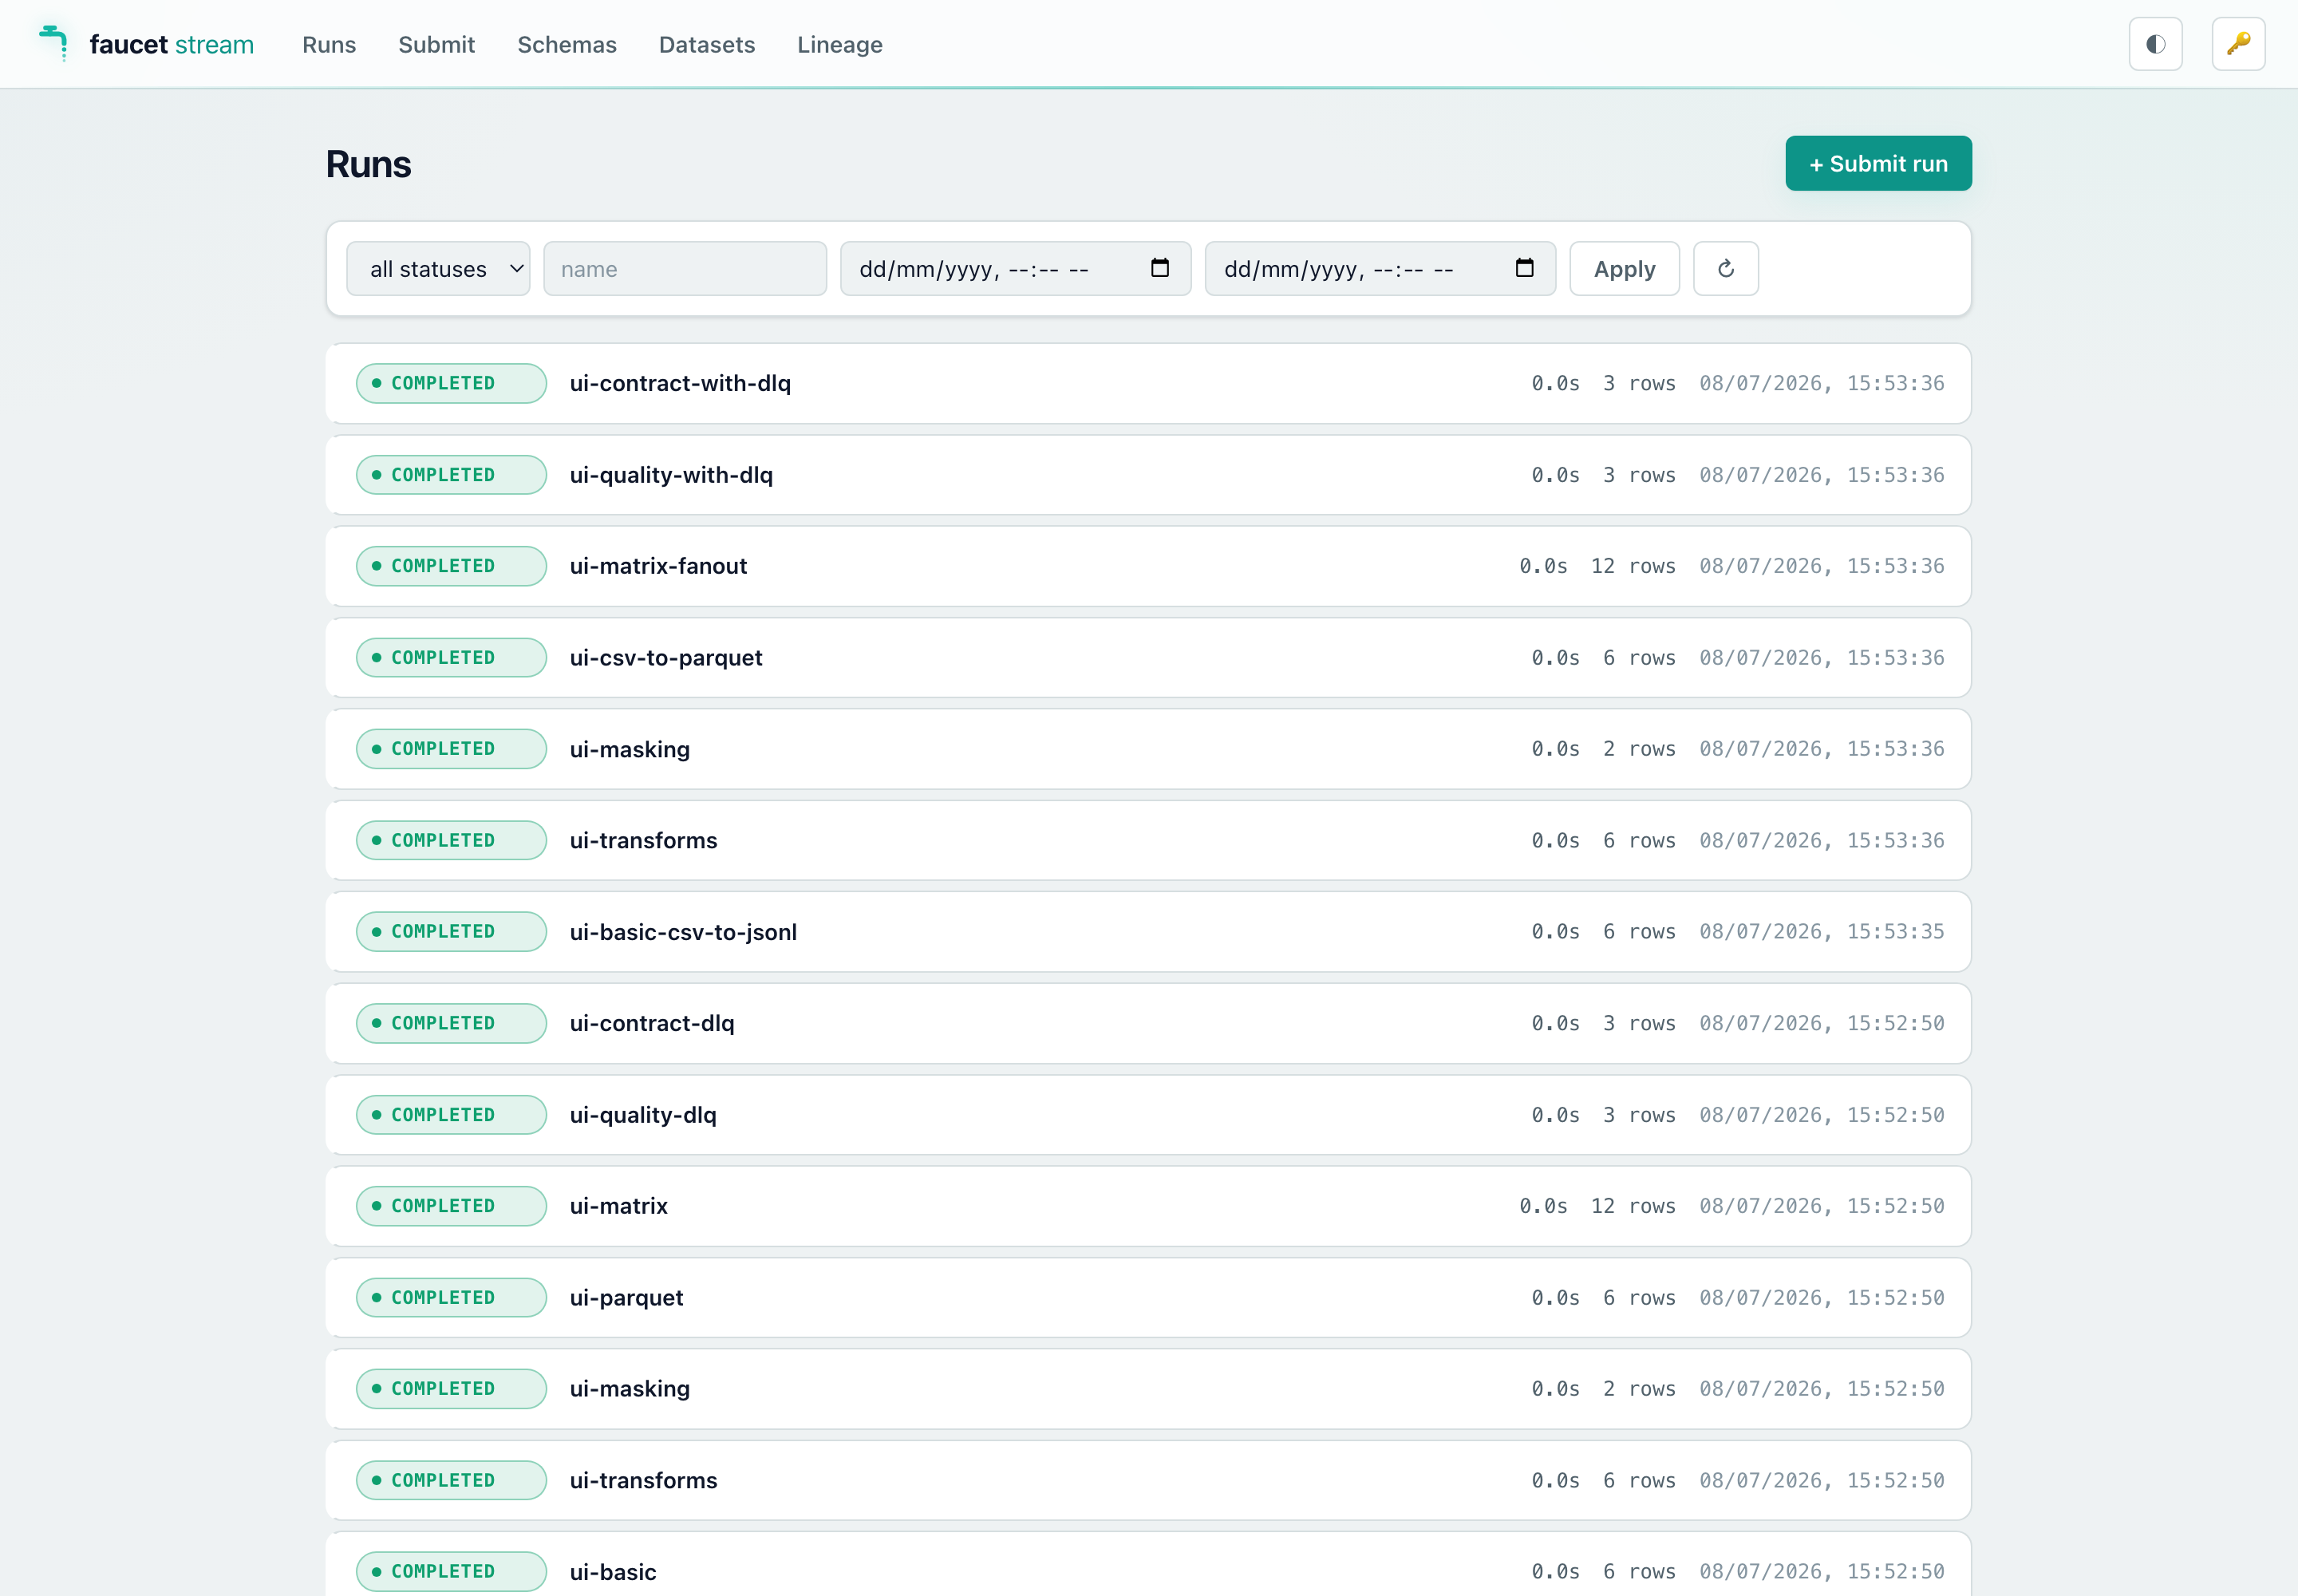
Runs dashboard
Lists all runs with live status badges. You can:
- Filter by name, status, or time range.
- Page through history.
- Click any row to open the run detail view.
- Click + Submit run to go directly to the Submit view.
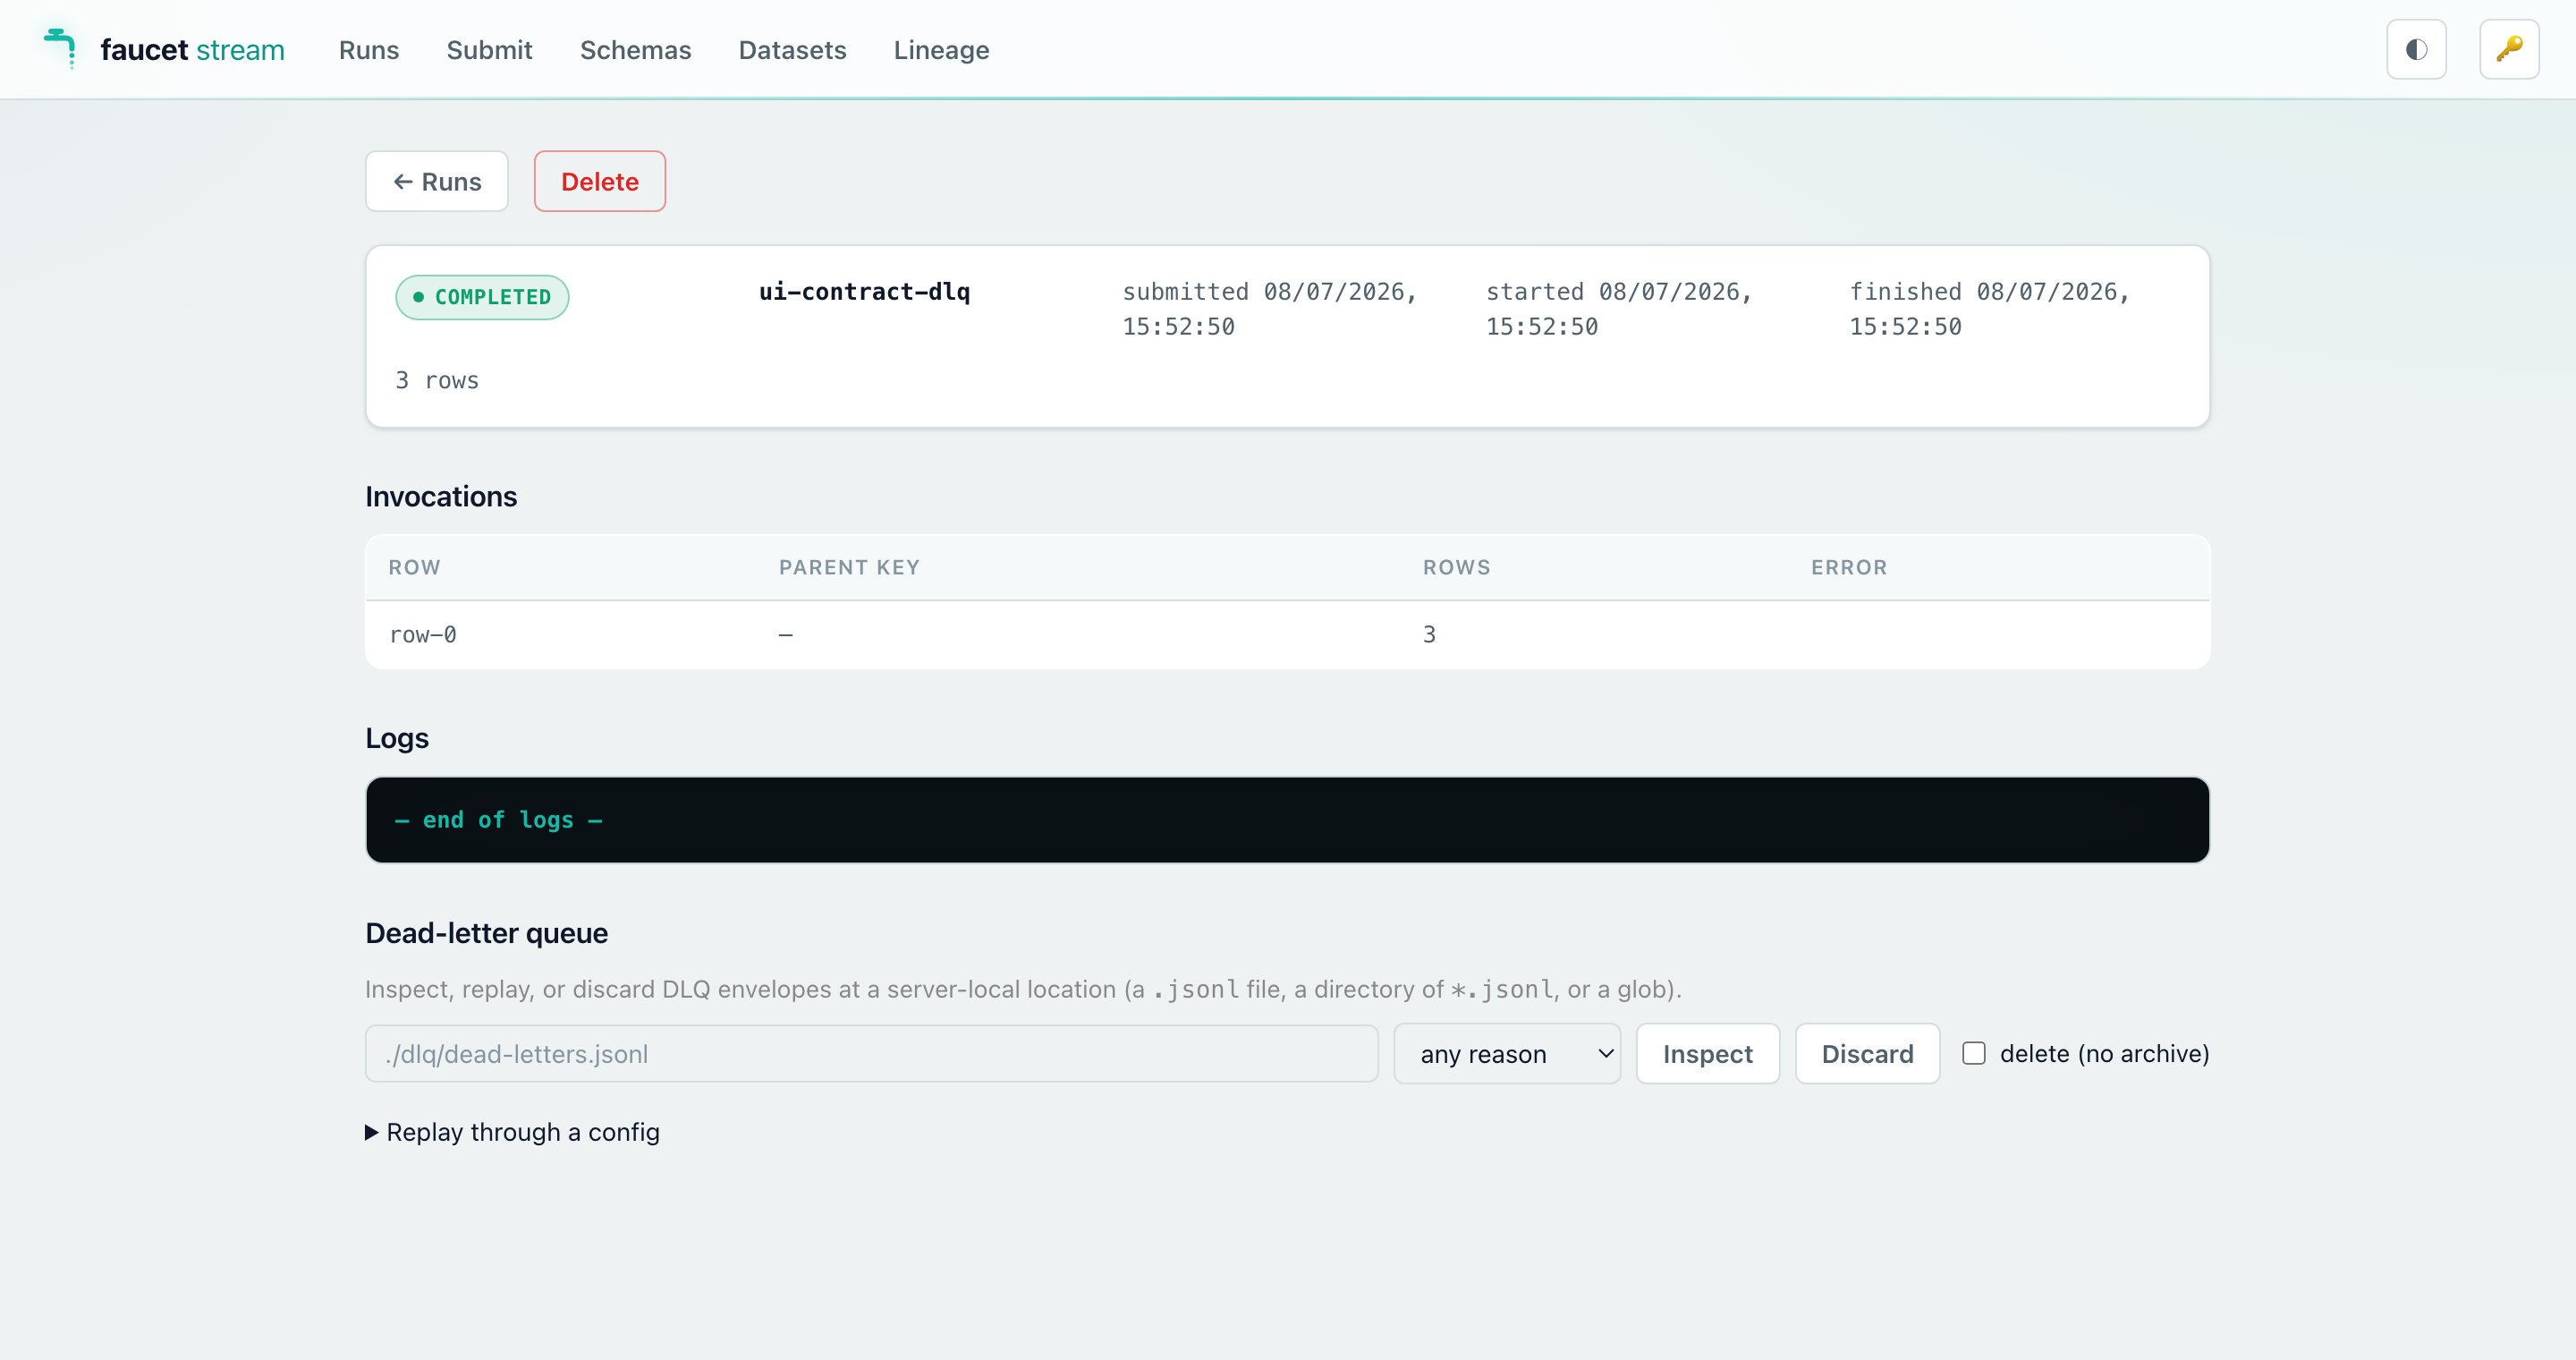
Run detail
Shows the full run record (status, timestamps, labels, config) plus every
invocation in the matrix. For in-flight runs it streams structured log events
live via SSE (the same GET /v1/runs/{id}/logs endpoint). You can cancel or
delete a run from this view.
It also embeds a dead-letter-queue panel — enter a server-local DLQ location
(a .jsonl file, a directory, or a glob), then Inspect it (grouped by
reason), Discard envelopes (optionally archiving first), or Replay
through a config — paste a pipeline config and re-feed the quarantined
payloads through its transforms / quality / contract / sink, with a dry-run
toggle. This is the DLQ replay workflow, in the browser (backed by
POST /v1/dlq/{inspect,replay,discard}).
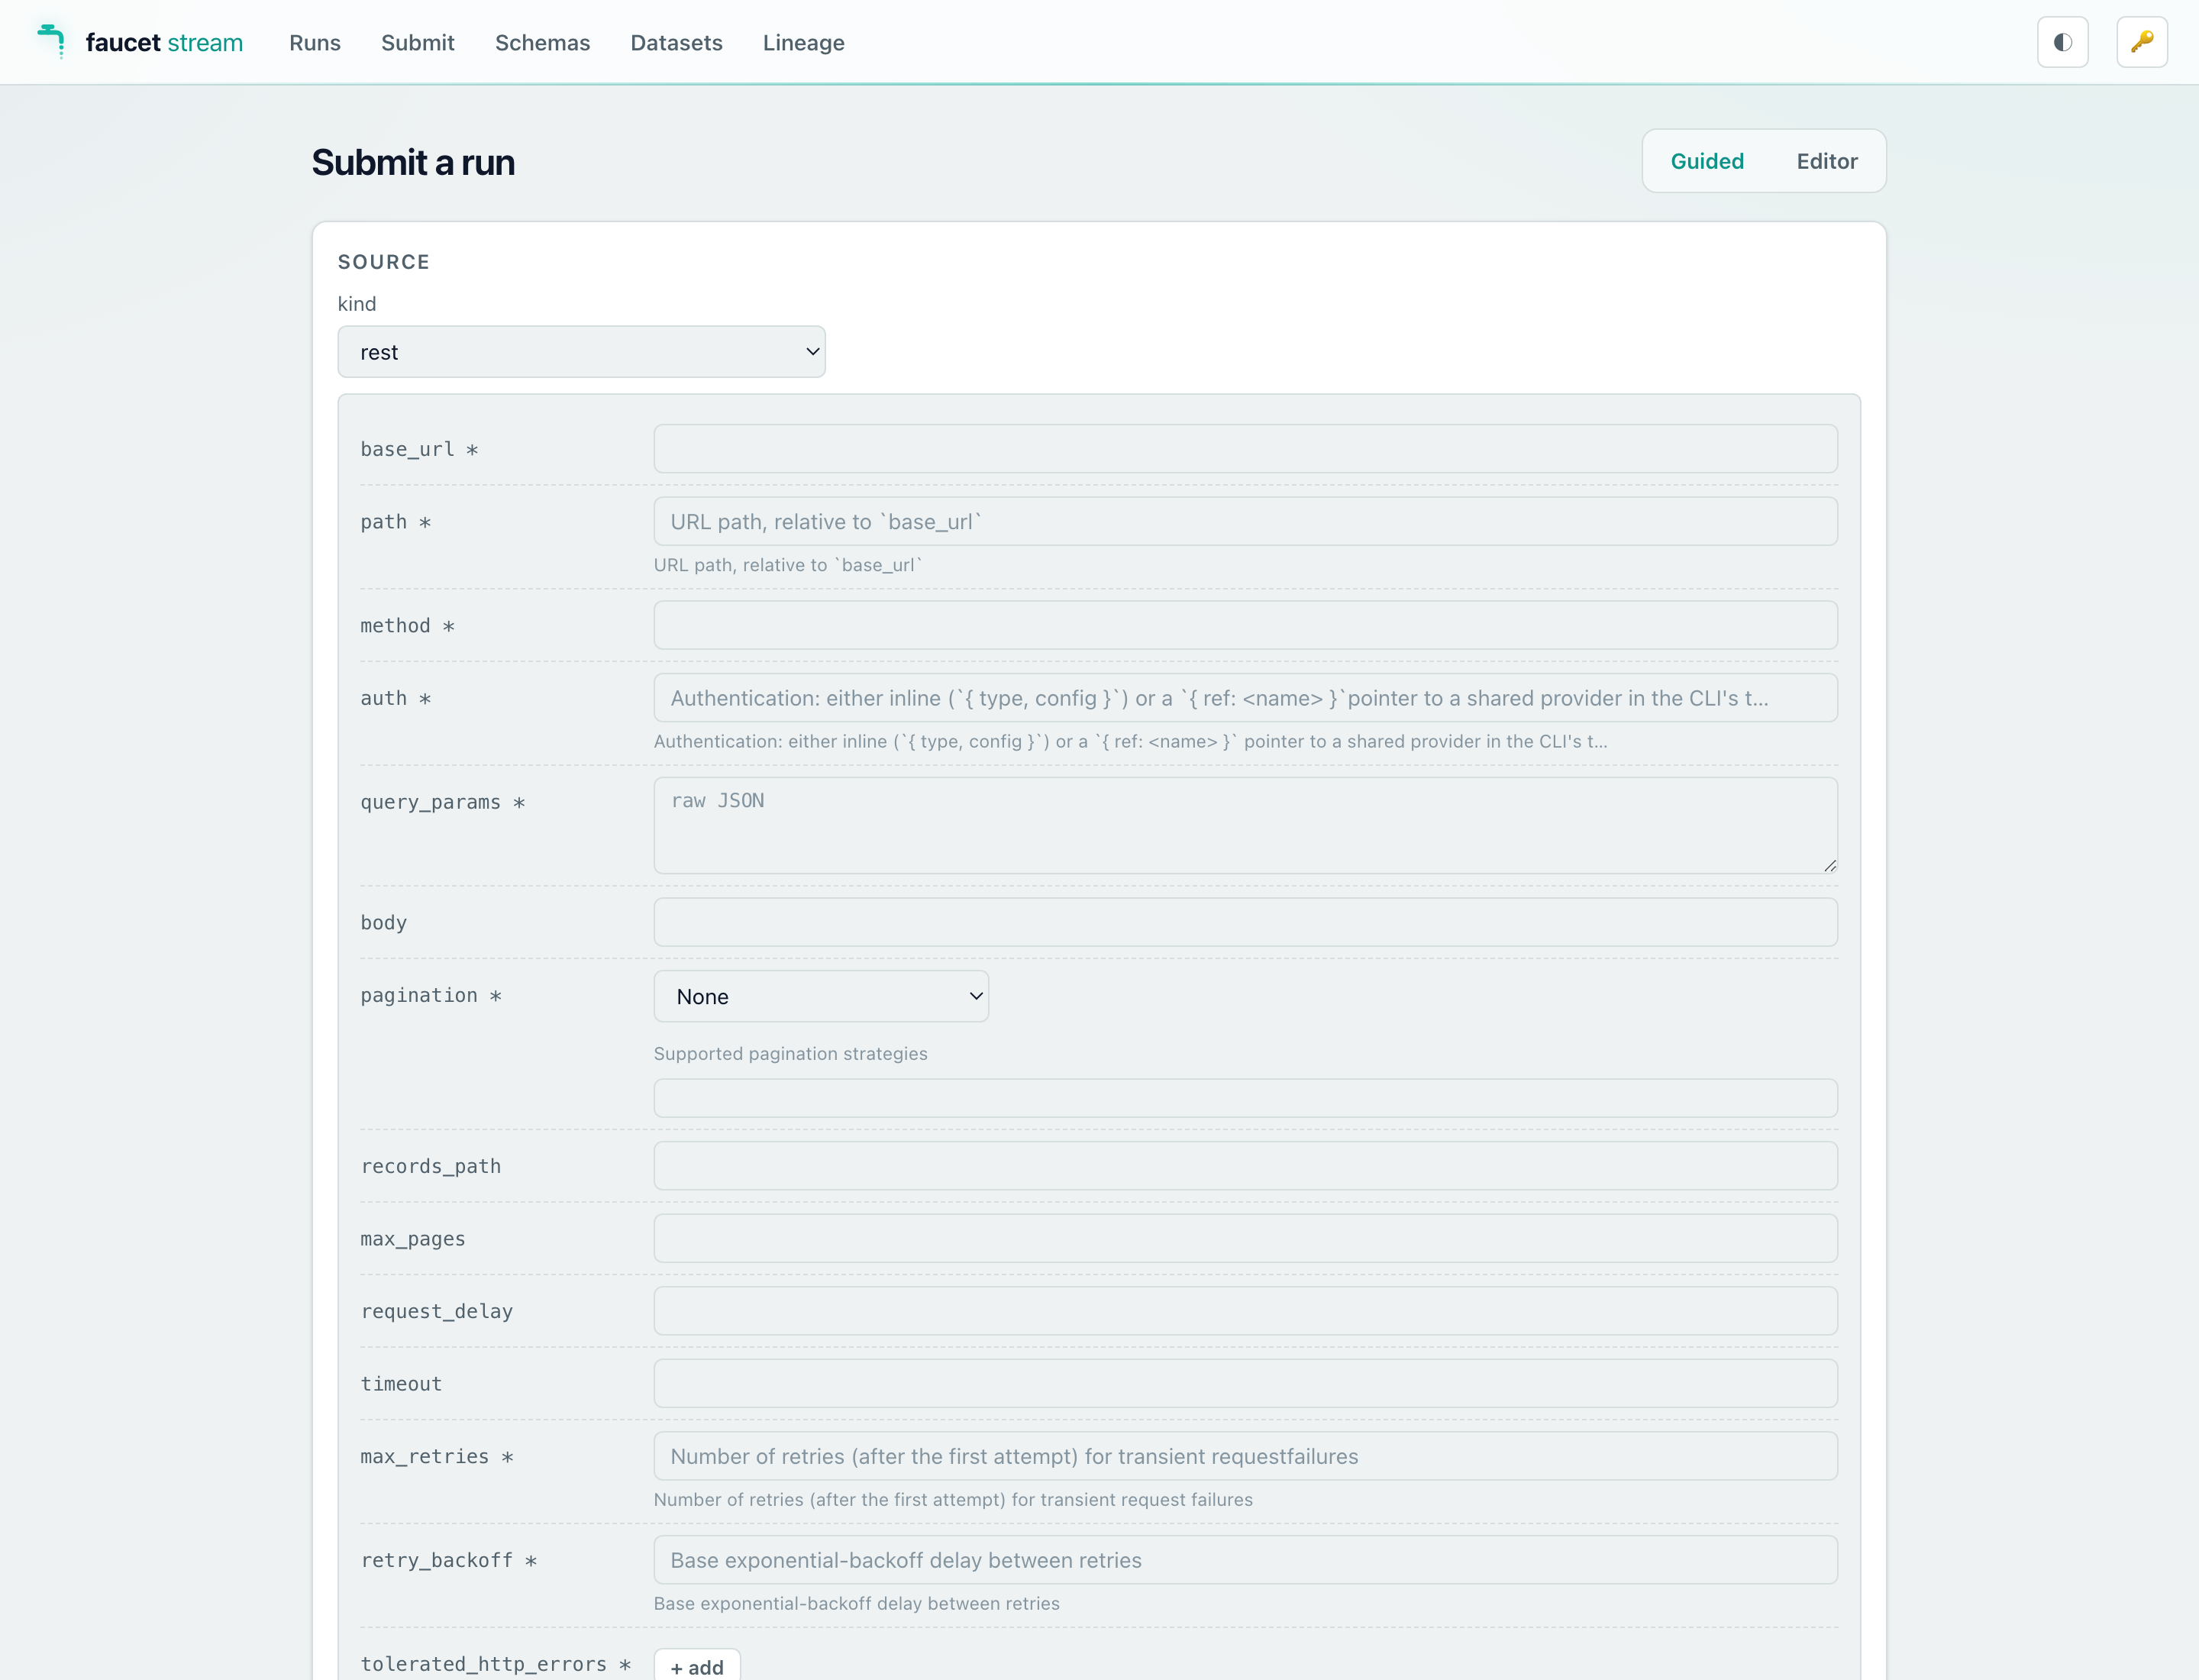
Submit
Two modes for submitting a new pipeline run:
- Raw editor — paste or type YAML/JSON directly into a text area. The same
format accepted by
POST /v1/runs. - Schema wizard — select a source and sink from the compiled connector list,
fill in the generated form fields, and the wizard assembles a valid config.
The form is derived from the same JSON Schemas returned by
GET /v1/schemas/{kind}/{name}.
Schemas explorer
Browses the connector catalog compiled into the running server
(GET /v1/schemas). Click any source, sink, or transform to view its full
JSON Schema — useful for checking config field names and types without leaving
the browser.
Datasets & Lineage (Data Movement Catalog)
When the server is built with the catalog feature, two more views browse the
Data Movement Catalog accumulated in the --history backend:
-
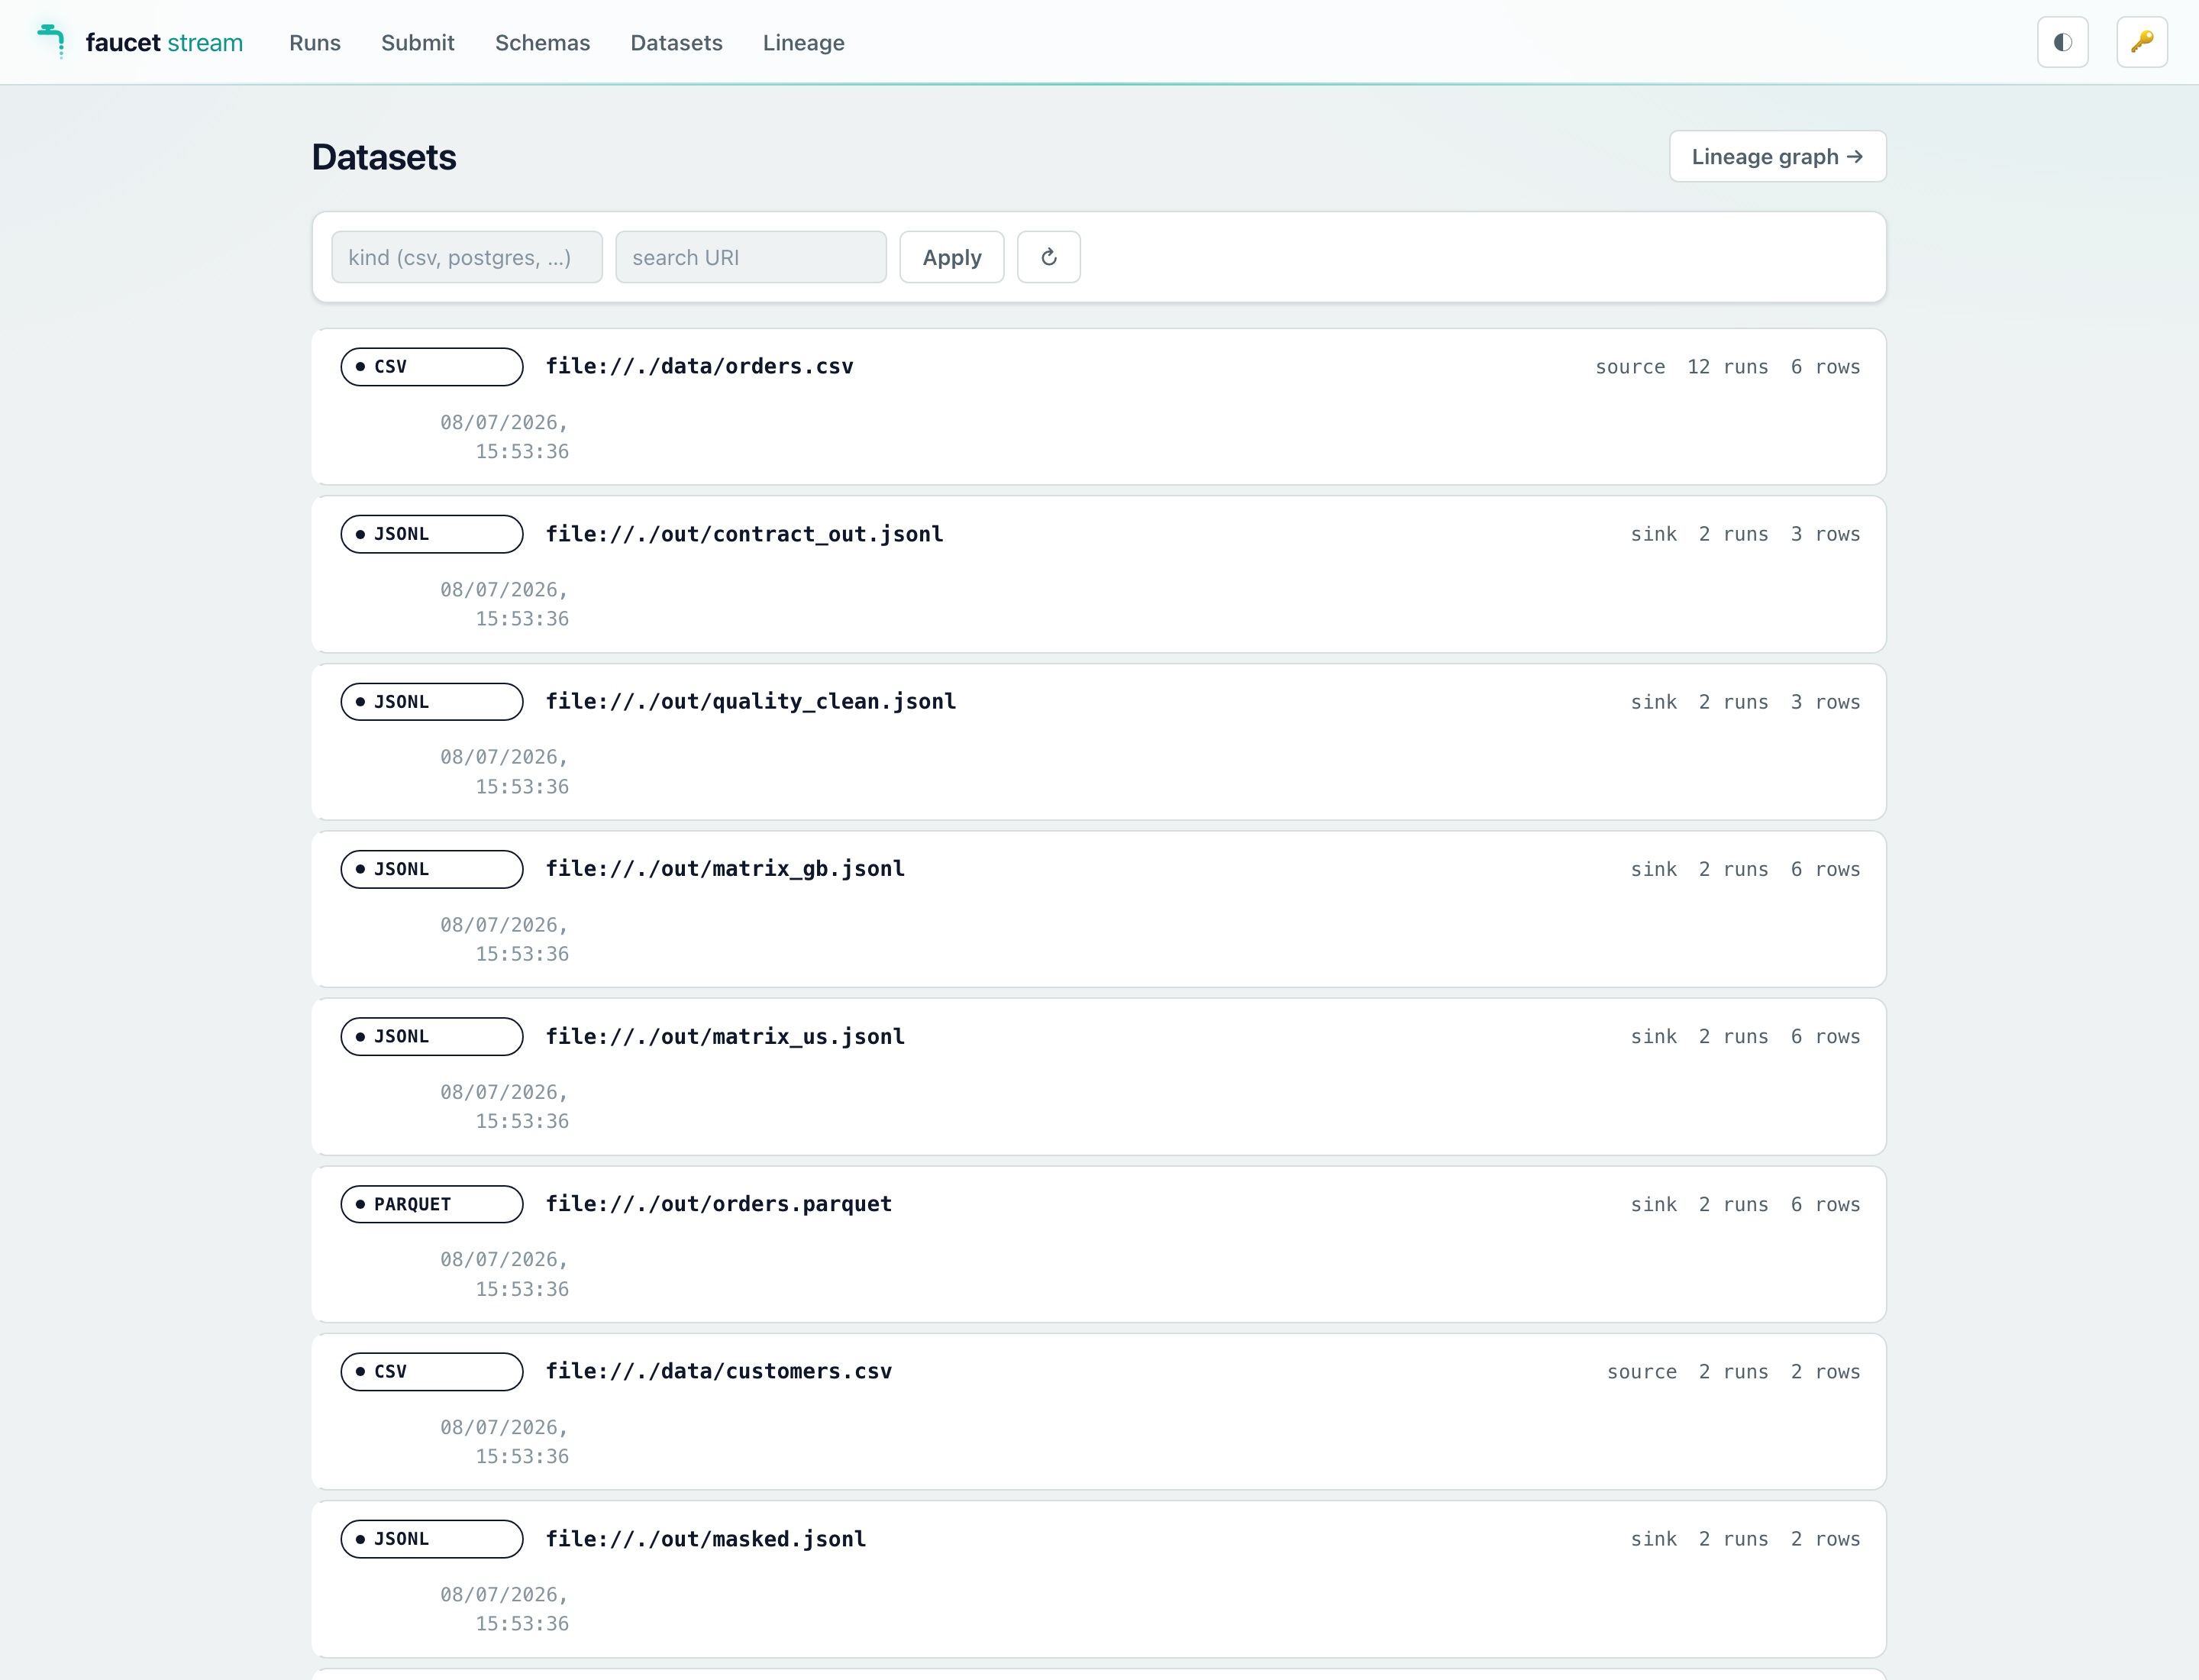
Datasets — a filterable list (kind / URI search) of every dataset the server’s pipelines have touched. Clicking a dataset opens its detail: freshness and run counters, per-run volume bars, the deduplicated schema timeline with per-version diff badges, and its upstream/downstream edges.
-
Lineage — the source→sink edge graph rendered as a layered SVG (sources left, sinks right). Hover an edge for the pipeline/run context; click a node to open its dataset detail; open a rooted, depth-bounded slice from any dataset’s detail page.
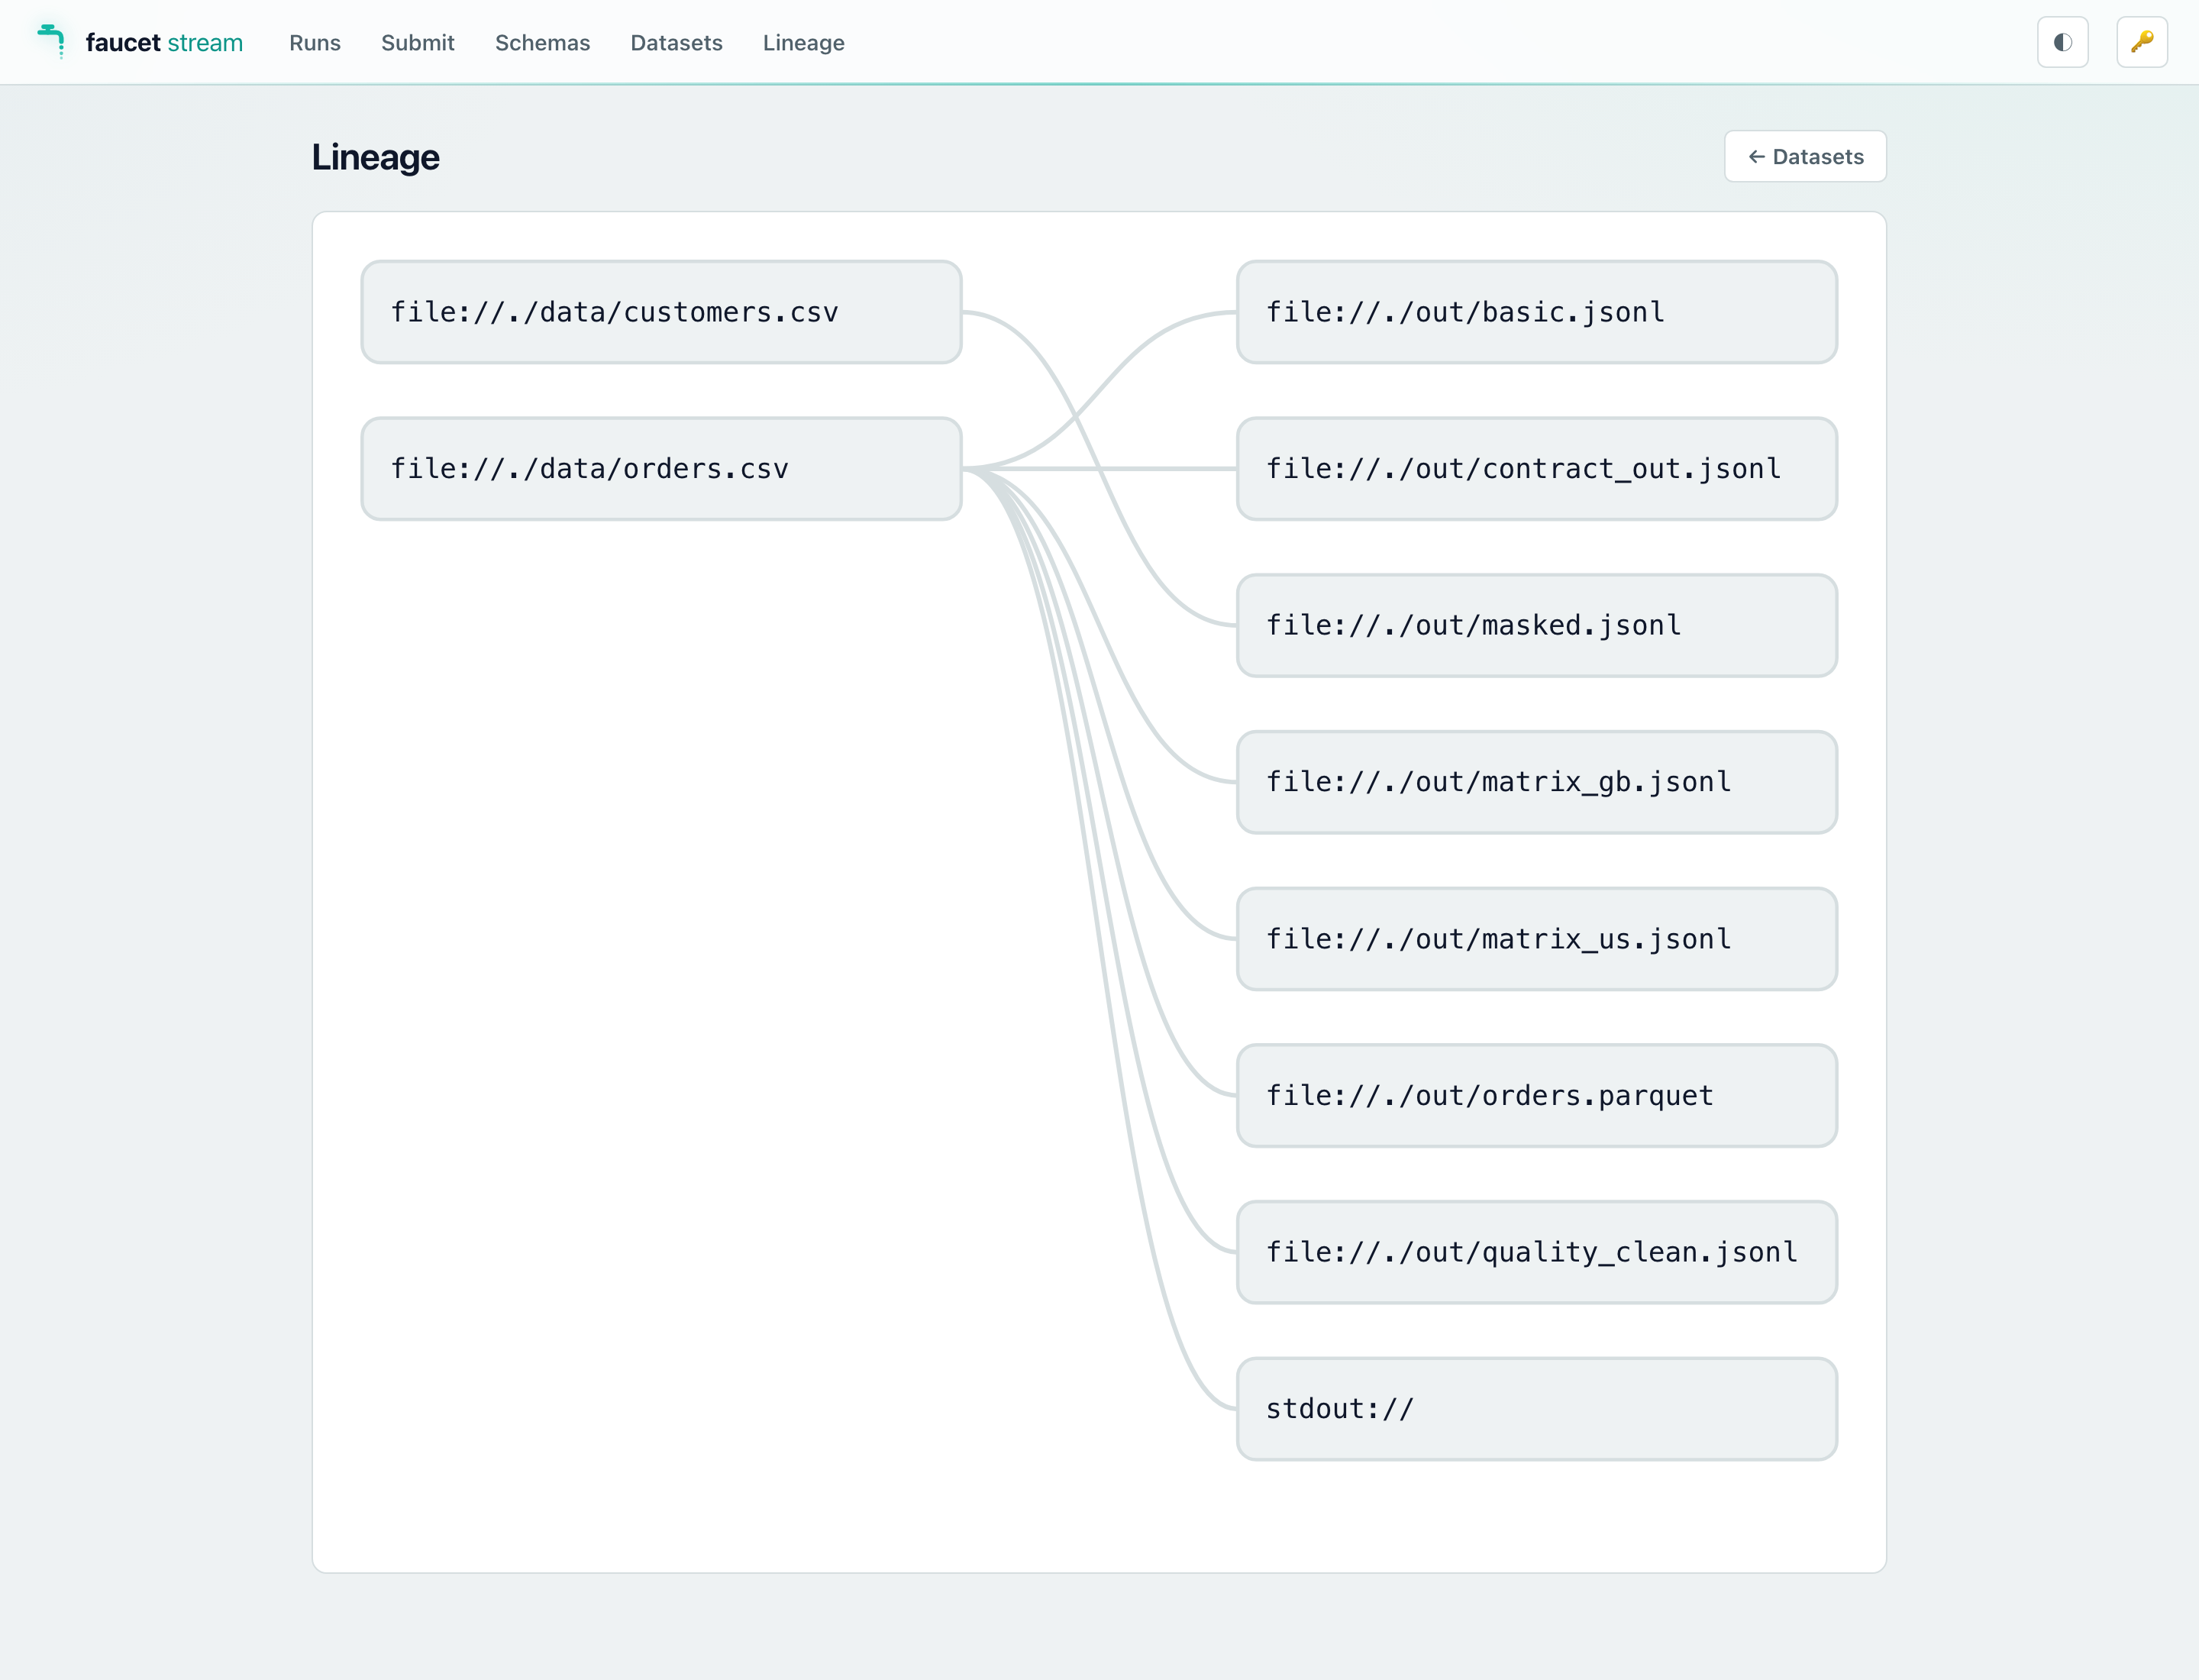
On a server built without the catalog feature both views show a short
“not available” notice (the endpoints are absent).
Disabling the console at runtime
If you built with serve-ui but want to serve only the API (no static assets),
pass --no-ui:
FAUCET_SERVE_AUTH_TOKEN=s3cret faucet serve --no-ui
/ and /assets/* return 404; the /v1 API and the unauthenticated probes
(/healthz, /readyz, /metrics) are unaffected.
New API endpoints
The serve-ui feature ships three new bearer-gated endpoints that the console
(and any other client) can call:
| Method | Path | Description |
|---|---|---|
GET | /v1/schemas | Catalog of all compiled sources, sinks, transforms, and state-store kinds. |
GET | /v1/schemas/{kind}/{name} | JSON Schema for one connector or transform (kind ∈ source/sink/transform). Returns 404 for unknown kind or name. |
POST | /v1/doctor | Validate and probe a submitted config without running it. Returns 200 (all probes pass) or 422 (any probe fails) with a probe report. Request body: { "config": "<yaml-or-json>", "config_format": "yaml" }. |
These endpoints require the serve feature and are available at runtime
regardless of whether --no-ui was passed.
Related pages
- Running faucet as a service — the full
faucet serveguide. - HTTP API reference — complete endpoint/schema reference.
faucet serveCLI flags — allfaucet serveflags.